9 Results
View results:
Sort by:
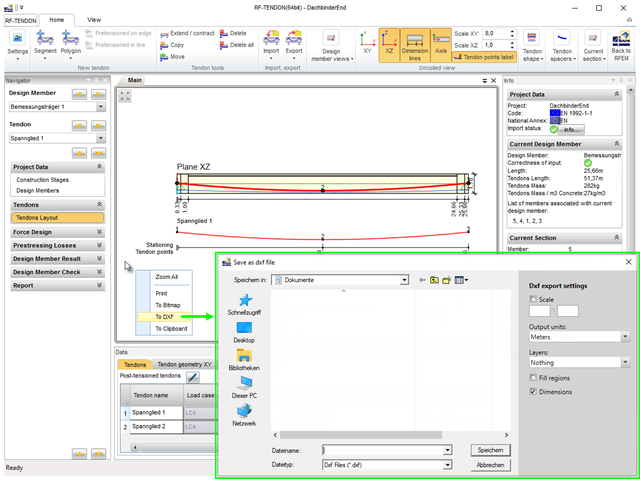
Once you have determined the final tendon geometry in RF‑TENDON, exporting the model to a CAD program can be useful. For this purpose, the module includes the option to export the file in the .dxf file format. You can select the export function by right-clicking the workspace. After selecting the DXF format and the storage location, additional settings can be made.
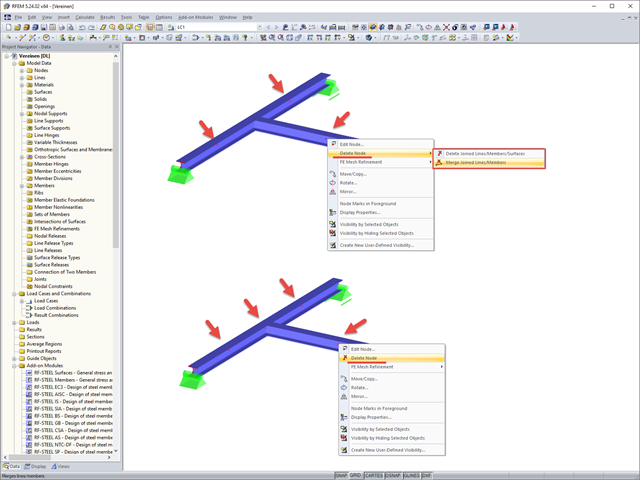
If you want to remove redundant nodes but keep connected objects, you can right-click the relevant node and select the "Delete Nodes" and "Merge Connected Members" options. In addition to members, you can also merge lines in RFEM.
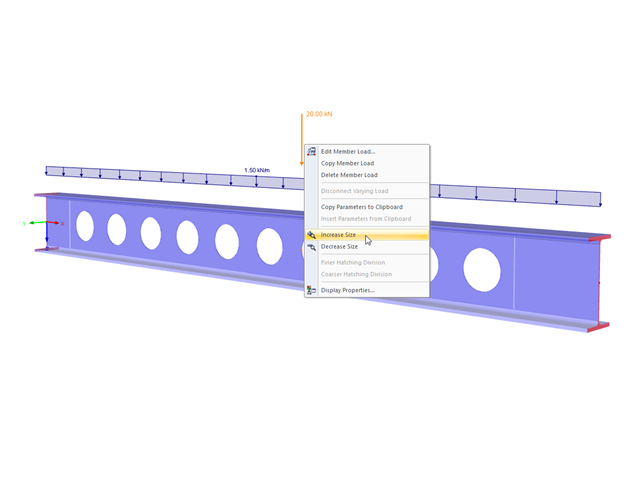
The display size of the load vectors can be adjusted quickly in the load shortcut menu: Right-click the load icon and select "Increase Display Size" or "Reduce Display Size" from the menu.
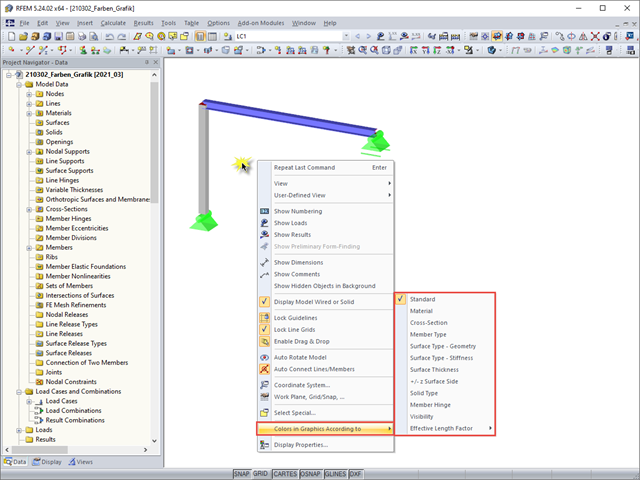
For a clearer display of the structure, you can display it in different colors. The corresponding selection can be opened by right-clicking the work window.
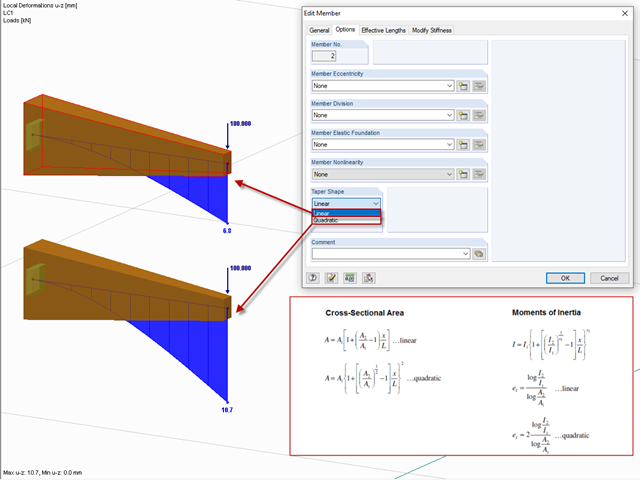
After right-clicking a member and selecting "Edit Member", you can find the "Taper Shape" option in the "Options" tab.
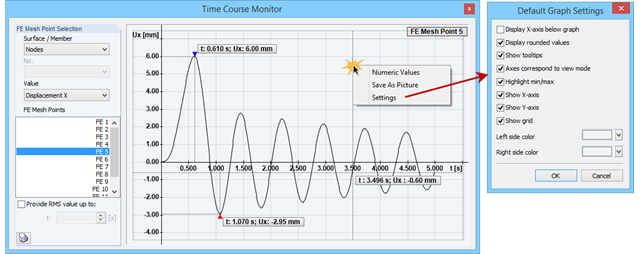
The Time Course Monitor displays the results of a time history analysis from RF‑/DYNAM Pro – Forced Vibrations. The graphic can be adjusted in the settings. This can be reached by right-clicking in the shortcut menu. For example, you can activate or deactivate the grid in the graphic. Those changes are overtaken into the printout report when you print the graphic.
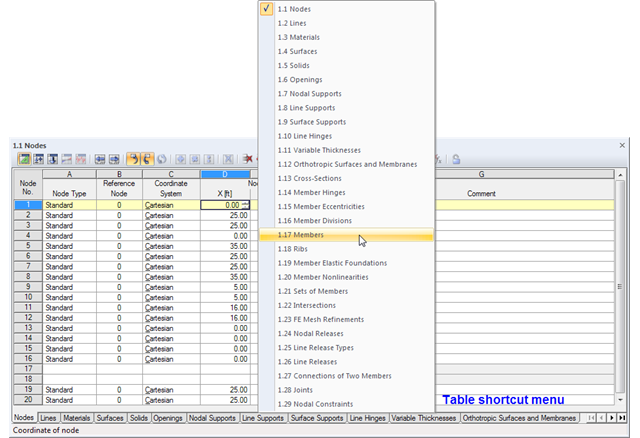
The geometry data of an RFEM model are currently managed in 29 tables, so not all of the tabs are displayed at once. To open a particular table, we recommend using the navigation menu that you can open by right-clicking on any tab. A shortcut menu appears, where you can quickly access the desired input table.
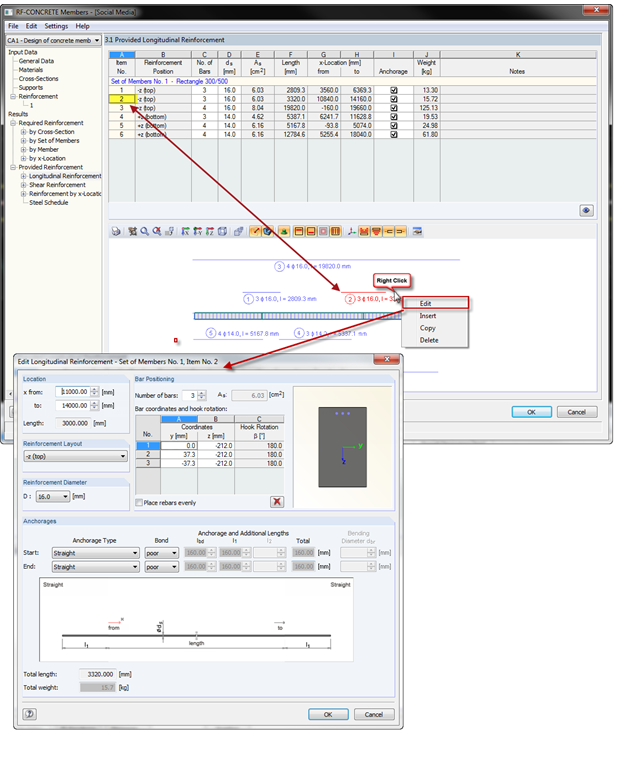
With the introduction of OSG graphics for the representation of design reinforcement in RF‑CONCRETE Members and CONCRETE, you can also select the reinforcement position directly in the graphic. Right-click the mouse to open the context menu where you can edit, copy, or delete the selected reinforcement position.
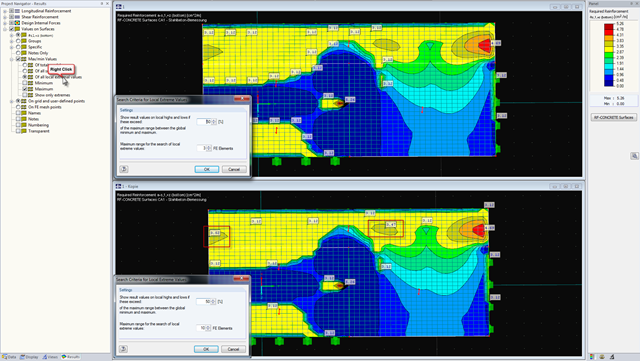
You can display the results on surfaces in a graphic. It may be useful to use the values on surfaces. Depending on the requirements, you can reduce the number of values considerably or adjust them to cover the entire structure. However, it is important to display the values that represent the local extreme values. In addition, it is necessary to determine the local extremes. This can be done by right-clicking this function in the Navigator.